This page supplements the Australian cycling safety report(Opens in a new tab/window) from the Bureau of Infrastructure and Transport Research Economics (BITRE), which describes safety and participation rates of cycling in Australia up to 2014.
Key statistics
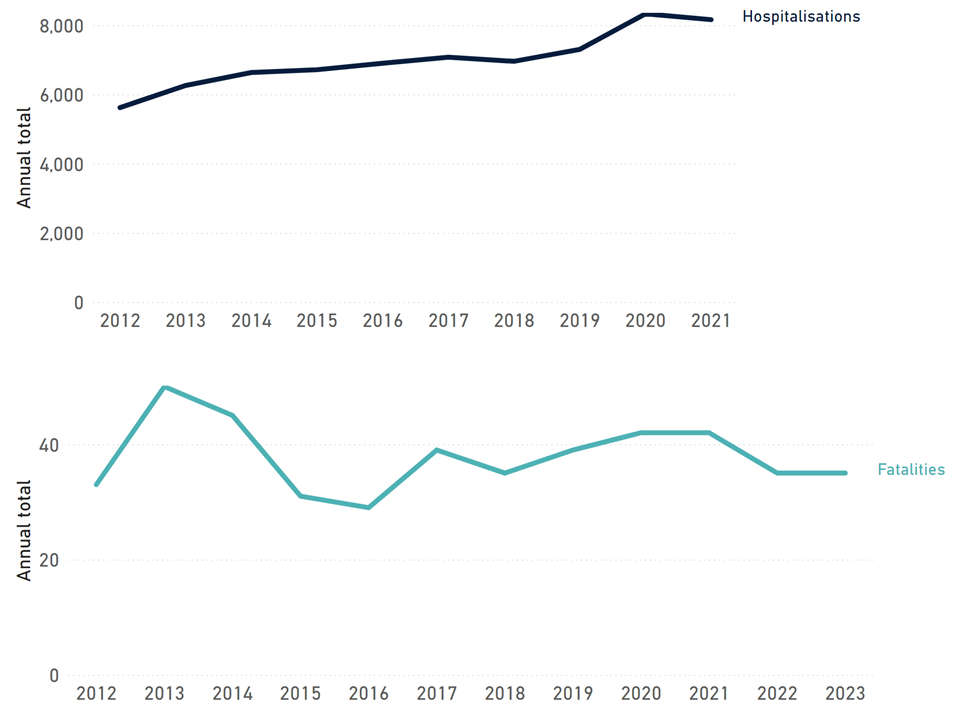
In 2023 there were 35 cyclist fatalities on Australian roads which was 3% of all road fatalities, down from 45 (4% of all fatalities) in 2014.
In 2021 (latest data available), 8,163 cyclists were hospitalised, which was 20.7% of all road hospitalisations: this is a higher proportion than in 2014 when 6,636 cyclists were hospitalised, representing 18.7% of all road hospitalisations.
Annual traffic cyclist casualties, 2012-2021

Data source: Australian Institute of Health and Welfare, Australian Road Deaths Database
Annual traffic cyclist casualties, 2012-2021
Year | Hospitalisations | Proportion of all road hospitalisations | Fatalities | Proportion of all road fatalities |
|---|---|---|---|---|
2012 | 5,621 | 16.5% | 33 | 2.5% |
2013 | 6,262 | 17.9% | 50 | 4.2% |
2014 | 6,636 | 18.7% | 45 | 3.9% |
2015 | 6,716 | 18.1% | 31 | 2.6% |
2016 | 6,904 | 17.7% | 29 | 2.2% |
2017 | 7,076 | 18.0% | 39 | 3.2% |
2018 | 6,959 | 17.6% | 35 | 3.1% |
2019 | 7,302 | 18.3% | 39 | 3.3% |
2020 | 8,332 | 21.9% | 42 | 3.8% |
2021 | 8,163 | 20.7% | 42 | 3.7% |
2022 | _ | _ | 35 | 3.0% |
2023 | _ | _ | 35 | 2.8% |
Data source: Australian Institute of Health and Welfare, Australian Road Deaths Database
Hospitalisations by age group and sex
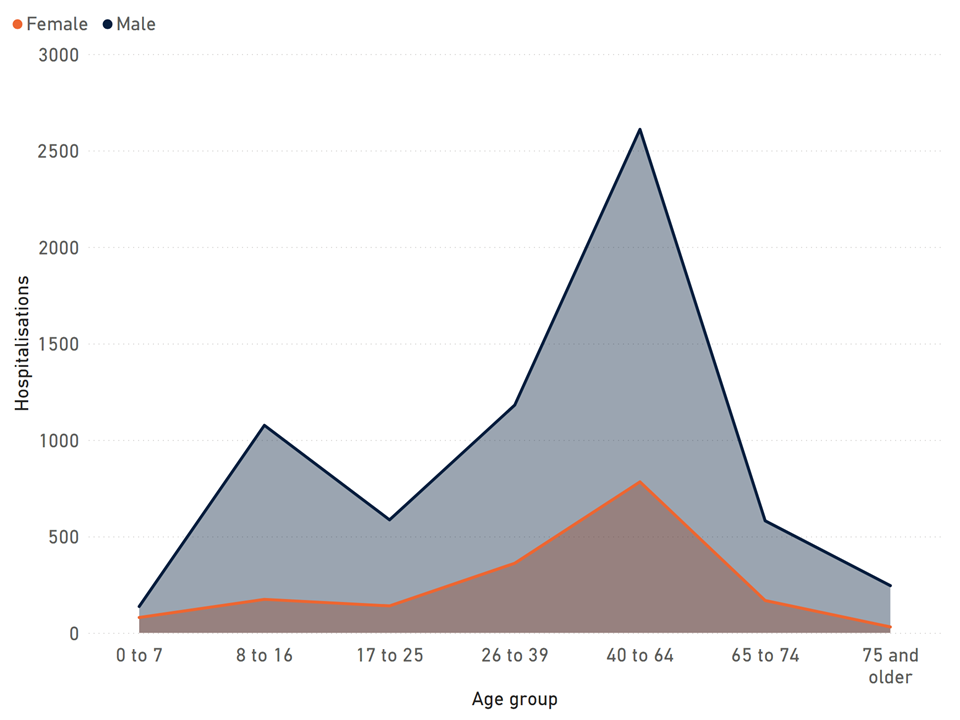
In 2021, 6,425 male cyclists and 1,737 female cyclists were hospitalised after road crashes, meaning that almost 80% of hospitalised cyclists are males.
Cyclists aged 40-64 had the highest number of hospitalisations: 2,610 male cyclists and 783 female cyclists. The age groups with the greatest proportion of hospitalised males are 8-16 and 75+, where 6.2 and 8.2 males are hospitalised for every female respectively.
Cyclist hospitalisations after road crashes by age group – 2021

Data source: Australian Institute of Health and Welfare
Cyclist hospitalisations after road crashes by age group – 2021
| Age group | 0-7 | 8-16 | 17-25 | 26-39 | 40-64 | 65-74 | 75+ | Total |
|---|---|---|---|---|---|---|---|---|
| Male | 137 | 1,076 | 586 | 1,181 | 2,610 | 581 | 245 | 6,425 |
| Female | 80 | 174 | 140 | 361 | 783 | 168 | 31 | 1,737 |
| Ratio Male to Female | 1.7 | 6.2 | 4.2 | 3.3 | 3.3 | 3.5 | 8.2 | 3.7 |
Data source: Australian Institute of Health and Welfare
Crashes by crash type
Around 85% of reported cyclist casualty crashes involve another vehicle, most often a light vehicle. Around 25% of cyclist casualty crashes occur when 2 vehicles, including the cyclist approach an intersection from perpendicular or opposing directions. Other frequent crash types are side-swipes (14%), collisions with vehicle doors (7%) and rear-ends (6%).
Casualty crash types, 2008-2013
| Single-vehicle (one cyclist only) | Multi-vehicle | ||
|---|---|---|---|
| Non-collision (Straight) – Out of Control | 47% | Adjacent Directions – Cross Traffic | 14% |
| Non-collision (Straight) – Off Left | 10% | Opposing Directions – Right Thru | 12% |
| Non-collision (Curve) – Out of control | 8% | Manoeuvring – From Footway | 10% |
| On Path – Object/Animal | 5% | Same Directions – Side-Swipe | 8% |
| Miscellaneous – Fell from vehicle | 3% | On Path – Vehicle door | 7% |
Non-collision (Curve) – Off carriageway at right bend | 2% | Manoeuvring – Emerge from Driveway | 6% |
| Pedestrian – Nearside | 2% | Same Direction – Rear-end | 6% |
| Other | 20% | Same Direction – Turning Side-Swipe | 6% |
| Adjacent Directions – Right Near | 6% | ||
| Adjacent Directions – Left Near | 5% | ||
| Other | 20% | ||
| Total case count | 100% | Total case count | 100% |
Data source: National Road Safety Research and Reporting Database
Crashes by speed limit
Cyclist casualty crashes are heavily skewed towards the lower posted speed zones such as 50 km/h and 60 km/h (National Road Safety Research and Reporting Database). Participation in cycling is increasing across many capital cities. However, for overall cycling participation, latest measures show flat or negative growth (Austroads).
Reported casualty crashes by posted speed limit, 2008-2013
| Posted speed limit (km/h) | Cyclist | All |
|---|---|---|
| ≤ 50 | 46% | 27% |
| 60 | 43% | 38% |
| 70-80 | 8% | 18% |
| ≥ 90 | 2% | 17% |
| Total | 100% | 100% |
Data source: National Road Safety Research and Reporting Database
About the data
The data referred to here is taken from:
- National Road Safety Research and Reporting Database (Bureau of Infrastructure and Transport Research Economics – BITRE)
- Australian Road Deaths Database(Opens in a new tab/window)
- National Cycling Participation Survey Census(Opens in a new tab/window) (Austroads)
- Journey to Work data (Opens in a new tab/window)(Australian Bureau of Statistics)
- Various participation surveys.
For more details, see Australian cycling safety: casualties, crash types and participation levels(Opens in a new tab/window)
Limitations
While we have taken care to nationally harmonise reporting of crashes involving cyclists, there are some inconsistencies in how crash data is recorded between states and territories.
Explore related data and insights
Have a question or feedback?
Contact the Road Safety Data Hub team

