
Key figures
-
174pedestrian road deaths in 202410.8% higher than previous year
-
2,498pedestrian hospitalised injuries in 20228.8% higher than previous year
-
155pedestrian road deaths in 2024 occurred in 50km/h or greater speed zones7.6% higher than previous year
-
106pedestrian road deaths in 2024 occurred in major cities16.5% higher than previous year
Pedestrians comprise the largest single road user group, with nearly 90% of Australians walking for transport or leisure each week (National Walking and Cycling Participation Survey, 2023). Pedestrians are identified as a vulnerable road user group in the National Road Safety Strategy 2021-2030.
Australia
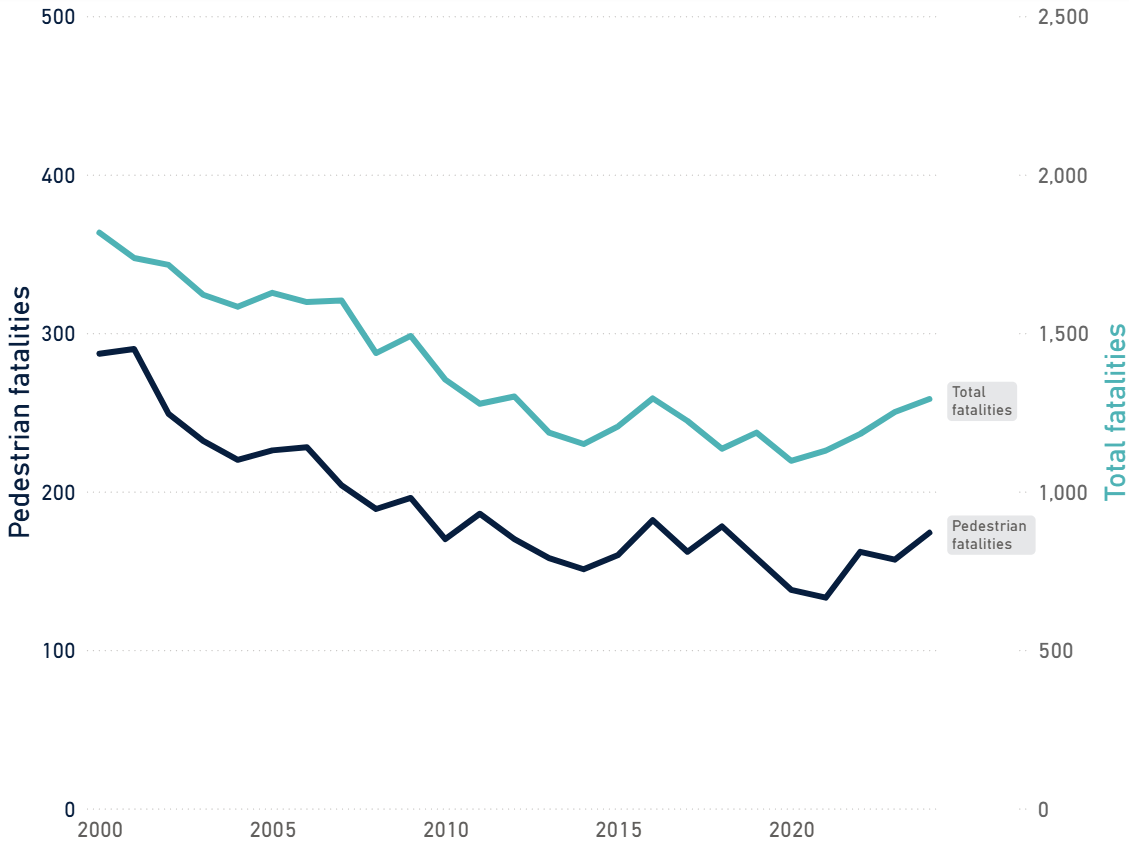
In Australia there has been a steady downward trend in total pedestrian fatalities:
• In the last 25 years since 2000, total road deaths have fallen by 523 (28.9%).
• In the same period, annual pedestrian fatalities decreased by 39.4%, from 287 fatalities in 2000 to 174 in 2024.
Annual pedestrian and total road fatalities, 2000-2024
Data source: ARDD
Annual pedestrian and total road fatalities, 2000-2024
| Year | Pedestrian fatalities | Total fatalities |
|---|---|---|
| 2000 | 287 | 1,817 |
| 2001 | 290 | 1,737 |
| 2002 | 249 | 1,715 |
| 2003 | 232 | 1,621 |
| 2004 | 220 | 1,583 |
| 2005 | 226 | 1,627 |
| 2006 | 228 | 1,598 |
| 2007 | 204 | 1,603 |
| 2008 | 189 | 1,437 |
| 2009 | 196 | 1,491 |
| 2010 | 170 | 1,353 |
| 2011 | 186 | 1,277 |
| 2012 | 170 | 1,300 |
| 2013 | 158 | 1,186 |
| 2014 | 151 | 1,150 |
| 2015 | 160 | 1,206 |
| 2016 | 182 | 1,294 |
| 2017 | 162 | 1,223 |
| 2018 | 178 | 1,135 |
| 2019 | 158 | 1,186 |
| 2020 | 138 | 1,097 |
| 2021 | 133 | 1,129 |
| 2022 | 162 | 1,182 |
| 2023 | 157 | 1,251 |
| 2024 | 174 | 1,294 |
Data source: ARDD
From 2000 to 2021 there was a downward trend in the share of pedestrians killed, reducing from 15.8% to 11.8% of all road deaths. Although total fatalities have risen since 2020, pedestrian fatalities in recent years have remained between 12 to 14 percent of the total.
Pedestrian fatalities as a percentage of all road fatalities, 2000-2024

Data source: ARDD
Pedestrian fatalities as a percentage of all road fatalities, 2000-2024
| Year | Pedestrian fatalities as a percentage of all road fatalities in Australia |
|---|---|
| 2000 | 15.8% |
| 2001 | 16.7% |
| 2002 | 14.5% |
| 2003 | 14.3% |
| 2004 | 13.9% |
| 2005 | 13.9% |
| 2006 | 14.3% |
| 2007 | 12.7% |
| 2008 | 13.2% |
| 2009 | 13.1% |
| 2010 | 12.6% |
| 2011 | 14.6% |
| 2012 | 13.1% |
| 2013 | 13.3% |
| 2014 | 13.1% |
| 2015 | 13.3% |
| 2016 | 14.1% |
| 2017 | 13.2% |
| 2018 | 15.7% |
| 2019 | 13.3% |
| 2020 | 12.6% |
| 2021 | 11.8% |
| 2022 | 13.7% |
| 2023 | 12.5% |
| 2024 | 13.4% |
Data source: ARDD
Australia compared to other countries
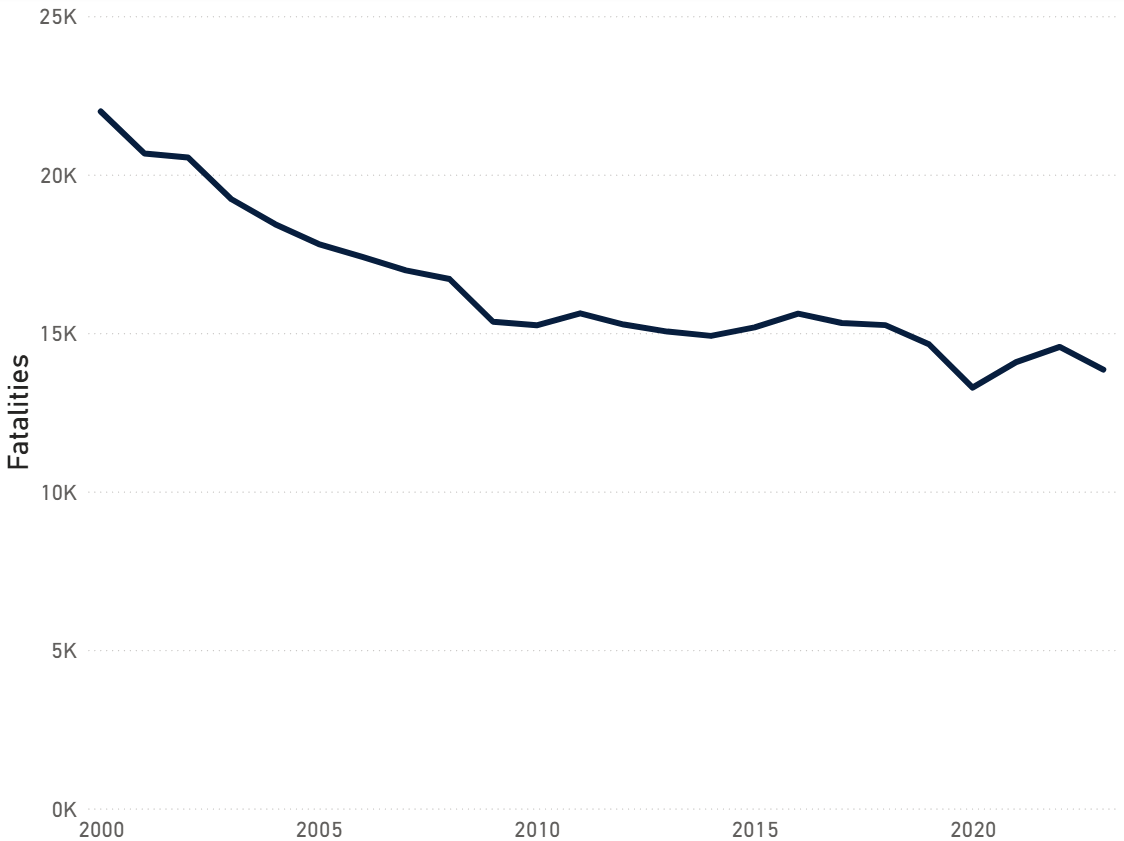
Total annual pedestrian fatalities across 34 OECD and 1 non-OECD countries have steadily decreased since 2000. Notably, the 2020 figure for combined pedestrian deaths (13,278) was the lowest in the period 2000-2023. Figures started to trend upward through 2021 and 2022, before 2023 saw a decrease of 719 deaths (4.9%) on the previous year.
Annual pedestrian fatalities, 34 OECD, 1 non-OECD countries, 2000-2023
Data source: IRTAD
Annual pedestrian fatalities, 34 OECD, 1 non-OECD countries, 2000-2023
| Year | International pedestrian fatalities |
|---|---|
| 2000 | 21,992 |
| 2001 | 20,667 |
| 2002 | 20,541 |
| 2003 | 19,222 |
| 2004 | 18,436 |
| 2005 | 17,810 |
| 2006 | 17,404 |
| 2007 | 16,978 |
| 2008 | 16,707 |
| 2009 | 15,358 |
| 2010 | 15,246 |
| 2011 | 15,624 |
| 2012 | 15,271 |
| 2013 | 15,048 |
| 2014 | 14,911 |
| 2015 | 15,182 |
| 2016 | 15,614 |
| 2017 | 15,318 |
| 2018 | 15,252 |
| 2019 | 14,648 |
| 2020 | 13,278 |
| 2021 | 14,083 |
| 2022 | 14,564 |
| 2023 | 13,845 |
Data source: IRTAD
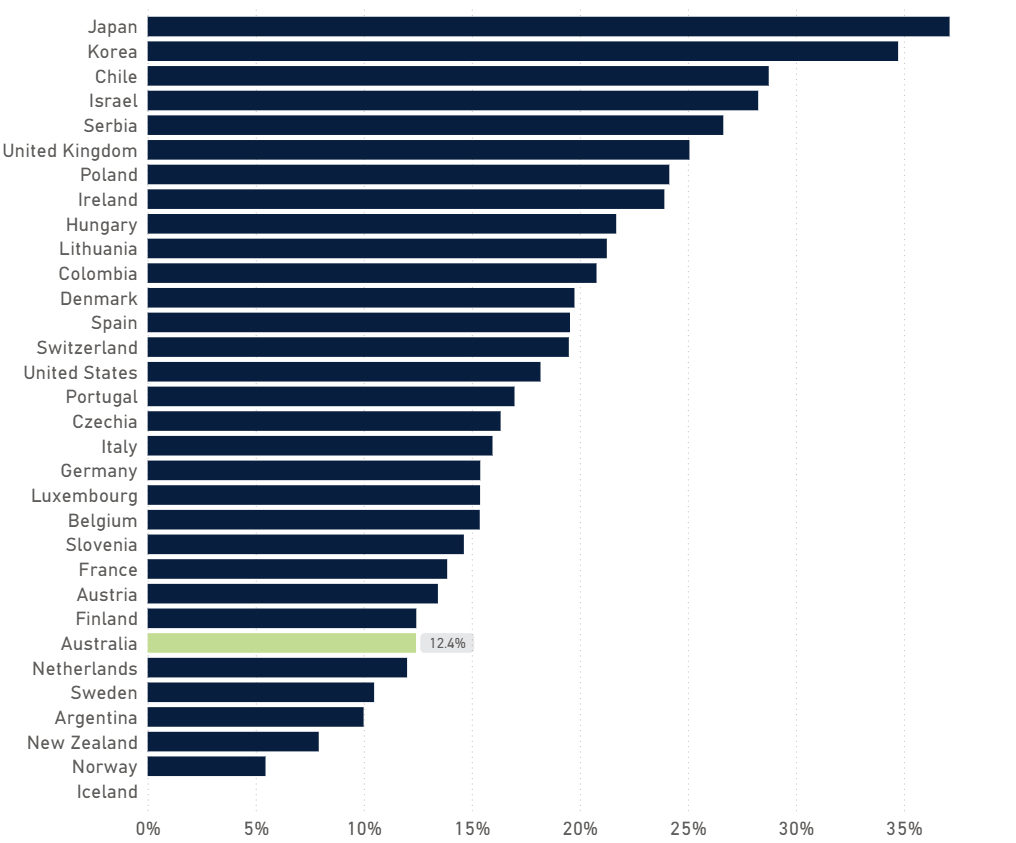
There is high variance in pedestrian fatalities as a percentage of all road fatalities between countries.
• In 2023, the percentage ranged from 0.0% for Iceland to 37.1% for Japan.
• In the same year, pedestrian fatalities in Australia comprised a total of 12.4% of all road fatalities.
Pedestrian fatalities as a percentage of all road fatalities, 34 OECD, 2 non-OECD countries, 2023
Data source: IRTAD
Pedestrian fatalities as a percentage of all road fatalities, 34 OECD, 2 non-OECD countries, 2023
| Country | Pedestrian fatalities as a percentage of all road fatalities |
|---|---|
| Japan | 37.1% |
| Korea | 34.7% |
| Chile | 28.7% |
| Israel | 28.3% |
| Serbia | 26.6% |
| United Kingdom | 25.1% |
| Poland | 24.1% |
| Ireland | 23.9% |
| Hungary | 21.7% |
| Lithuania | 21.3% |
| Colombia | 20.8% |
| Denmark | 19.8% |
| Spain | 19.5% |
| Switzerland | 19.5% |
| United States | 18.2% |
| Portugal | 17.0% |
| Czechia | 16.3% |
| Italy | 16.0% |
| Germany | 15.4% |
| Luxembourg | 15.4% |
| Belgium | 15.4% |
| Slovenia | 14.6% |
| France | 13.9% |
| Austria | 13.4% |
| Finland | 12.4% |
| Australia | 12.4% |
| Netherlands | 12.0% |
| Sweden | 10.5% |
| Argentina | 10.0% |
| New Zealand | 7.9% |
| Norway | 5.5% |
| Iceland | 0.0% |
Data source: IRTAD
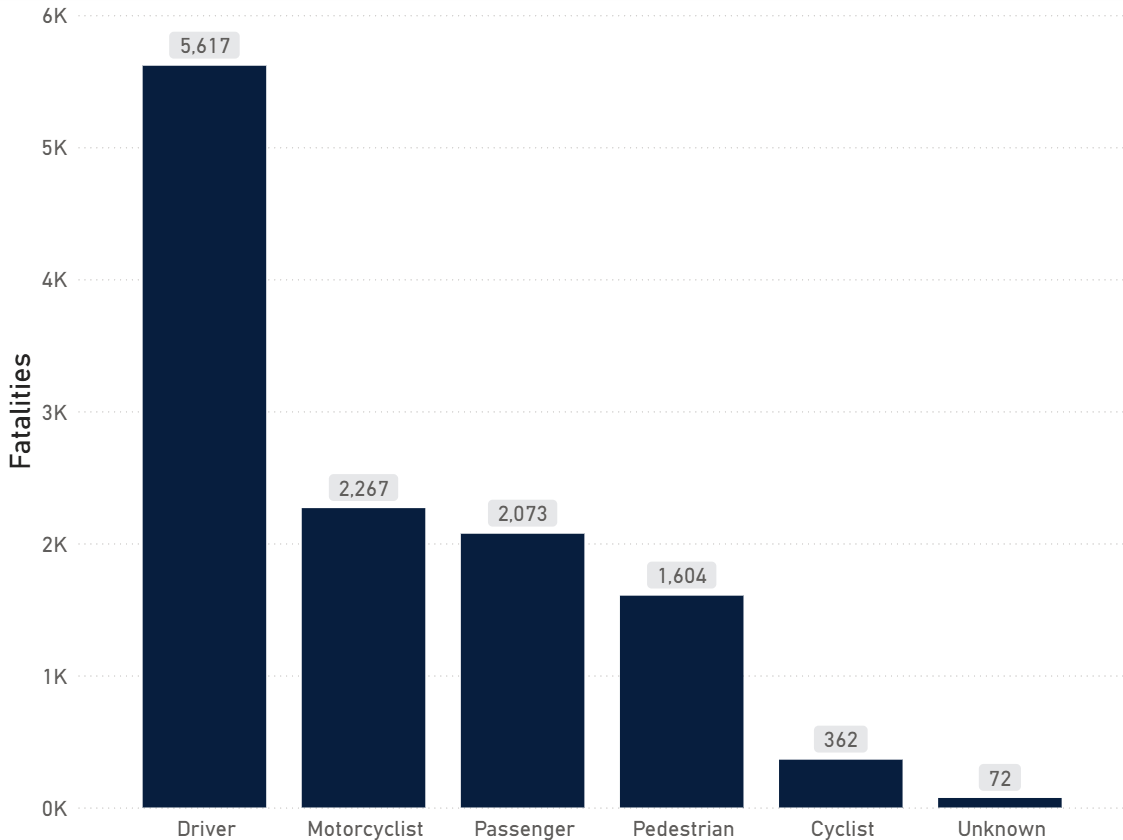
Fatalities by road user
Between 2015 and 2024:
- Pedestrians made up the second lowest share of total road fatalities in Australia (13.4%), followed by cyclists (3.0%), who represent less than a quarter of pedestrian deaths.
- Drivers were the most represented road user group, comprising 46.8% of all road fatalities.
These figures do not account for differences in exposure or participation for each road user type. For example, motorcyclists may be considered at higher risk as their total deaths exceed their exposure, if measured by license holders or Vehicle Kilometres Travelled (VKT, the total distance travelled by all the travellers in a network).
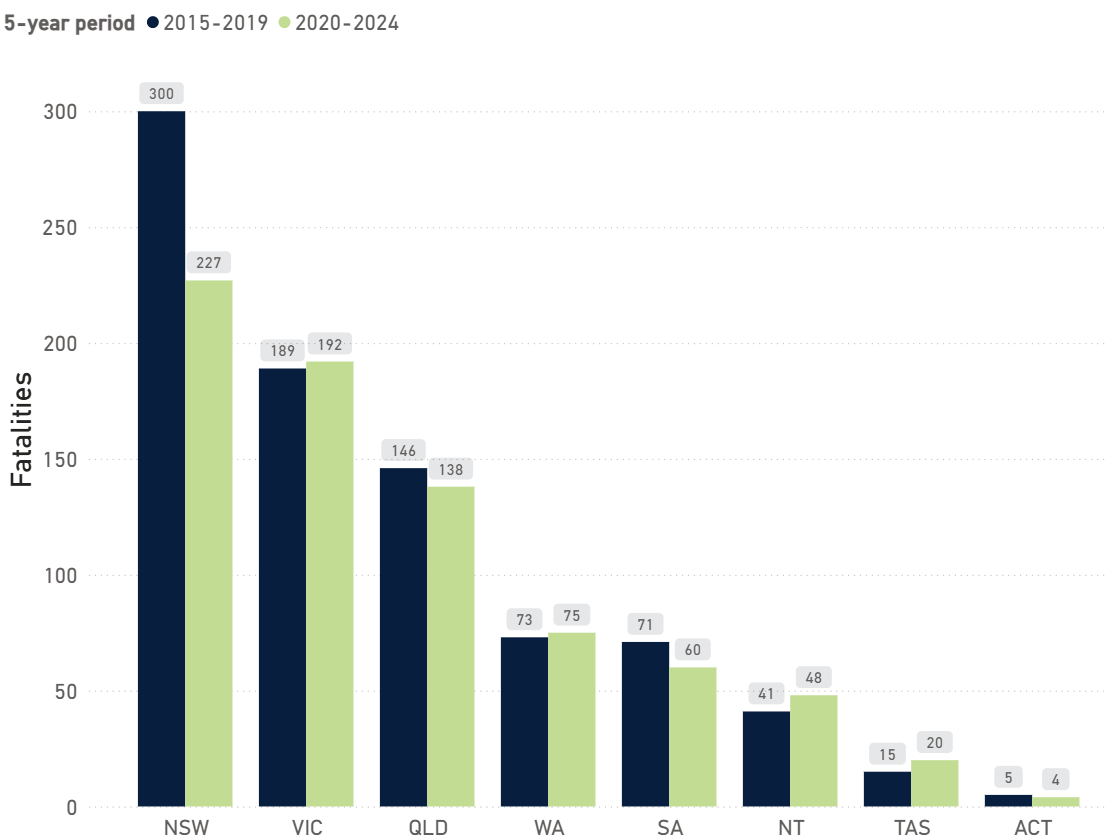
State and territory
NSW had the highest pedestrian fatality count in both 2015-2019 and 2020-2024. Vic, WA, Tas and the NT experienced an increase in pedestrian fatalities in 2020-2024, compared with the 5 years previous. All other states experienced decreases in pedestrian fatalities over the same period.
National injuries
Annual pedestrian hospitalised injuries and hospitalised injuries for all traffic accidents were relatively stable between 2017 and 2019. These both decreased in 2020, coinciding with the COVID-19 pandemic and the associated reduction in road user activity. Through 2021 and 2022, pedestrian injuries have increased towards historical averages. In contrast, total traffic hospitalised injuries have reduced to their lowest figure since 2017.
Annual pedestrian and total traffic hospitalised injuries, 2017-2022

Data source: AIHW
Annual pedestrian and total traffic hospitalised injuries, 2017-2022
| Year | Total hospitalised injuries | Pedestrian injuries |
|---|---|---|
| 2017 | 38,955 | 2,714 |
| 2018 | 39,166 | 2,660 |
| 2019 | 39,450 | 2,713 |
| 2020 | 37,474 | 2,088 |
| 2021 | 38,958 | 2,296 |
| 2022 | 35,628 | 2,498 |
Data source: AIHW
Risk factors
Age
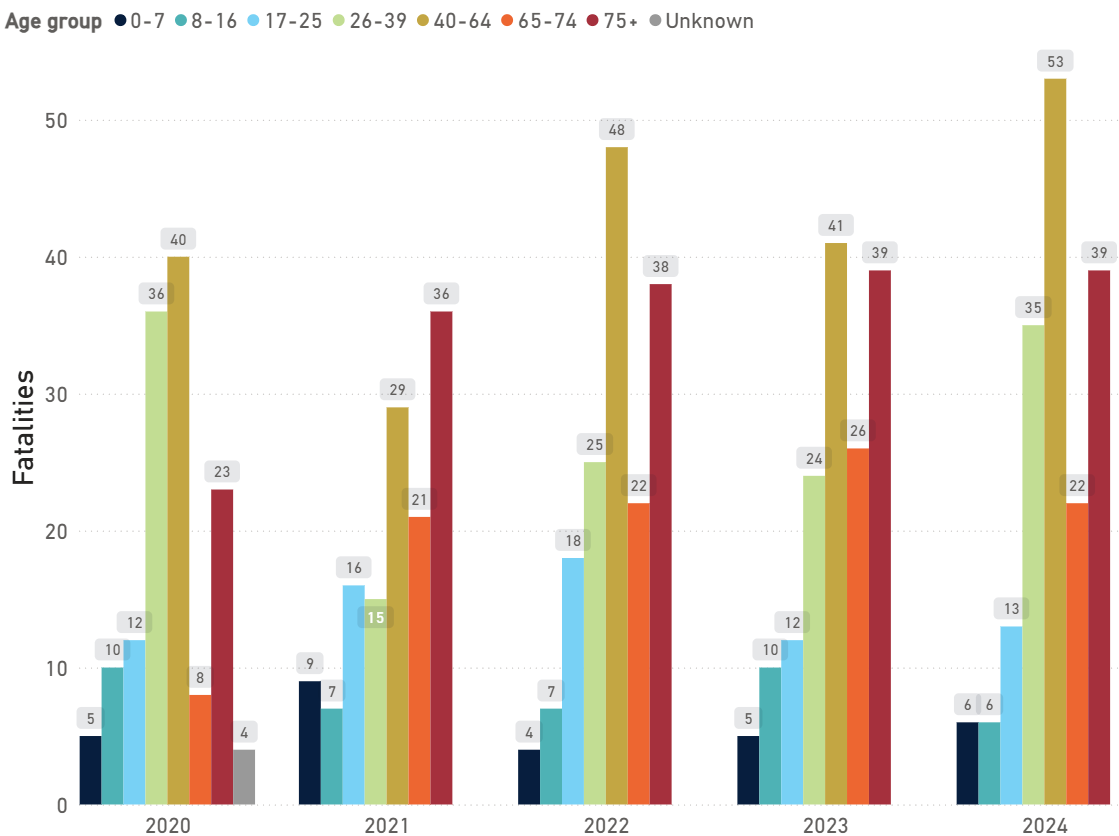
Between 2020 and 2024:
- The cohort with the greatest increase in pedestrian fatalities was people aged 75 years and over, with 16 more deaths (70.0% increase over the four-year period from 23 to 39 deaths).
- The cohort with the greatest decrease in pedestrian fatalities was people aged 8 to 16 years, with 4 less deaths (40.0% lower with 6 deaths in 2024 compared to 10 deaths in 2020).
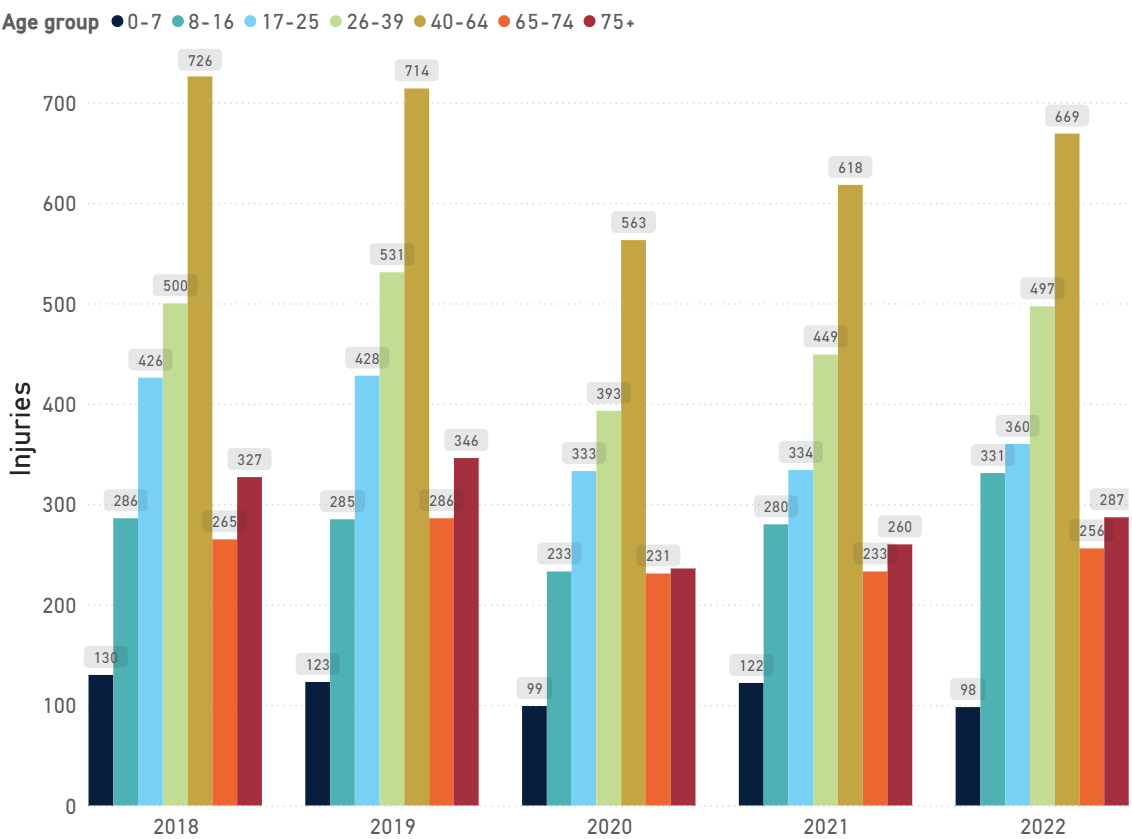
The last 5 years of available data (2018-2022) for pedestrian hospitalised injuries shows pedestrians in the 0-7 age group reported the lowest number of hospitalised injuries, and the 40-64 age group recorded the highest number.
Annual pedestrian hospitalised injuries by age group, 2018-2022
Data source: AIHW
Annual pedestrian hospitalised injuries by age group, 2018-2022
| Year | 0-7 | 8-16 | 17-25 | 26-39 | 40-64 | 65-74 | 75+ |
|---|---|---|---|---|---|---|---|
| 2018 | 130 | 286 | 426 | 500 | 726 | 265 | 327 |
| 2019 | 123 | 285 | 428 | 531 | 714 | 286 | 346 |
| 2020 | 99 | 233 | 333 | 393 | 563 | 231 | 236 |
| 2021 | 122 | 280 | 334 | 449 | 618 | 233 | 260 |
| 2022 | 98 | 331 | 360 | 497 | 669 | 256 | 287 |
Data source: AIHW
When fatalities and injuries are combined, the data shows that older pedestrians (aged 65+) account for a relatively small share of hospitalised injuries but are disproportionately represented in road fatalities. This may reflect older pedestrians sometimes have ‘reduced ability to deal with complex traffic situations and slower walking speed’ (Oxley et. al., 2005). Due to increased fragility as part of the ageing process, older pedestrians are also ‘less likely to survive the trauma associated with a road crash’ than younger people (Department of Infrastructure (Victoria), 2007).
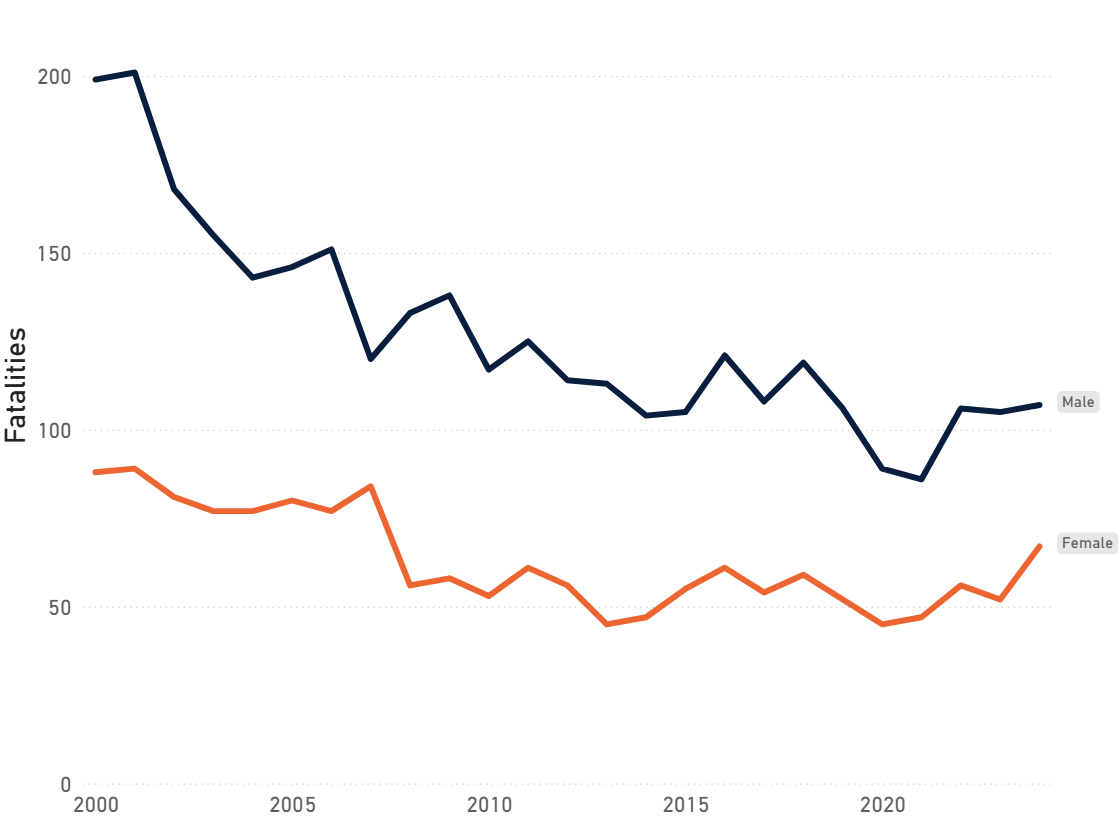
Sex
A breakdown of the number of pedestrian fatalities between 2000 and 2024 shows:
- Both male and female deaths have been trending down during this period.
- More male than female pedestrians are fatally injured each year, with the ratio of male to female deaths ranging between 1.4 and 2.5 over this period.
Annual pedestrian fatalities by sex, 2000-2024
Data source: ARDD
Annual pedestrian fatalities by sex, 2000-2024
| Year | Male | Female |
|---|---|---|
| 2000 | 199 | 88 |
| 2001 | 201 | 89 |
| 2002 | 168 | 81 |
| 2003 | 155 | 77 |
| 2004 | 143 | 77 |
| 2005 | 146 | 80 |
| 2006 | 151 | 77 |
| 2007 | 120 | 84 |
| 2008 | 133 | 56 |
| 2009 | 138 | 58 |
| 2010 | 117 | 53 |
| 2011 | 125 | 61 |
| 2012 | 114 | 56 |
| 2013 | 113 | 45 |
| 2014 | 104 | 47 |
| 2015 | 105 | 55 |
| 2016 | 121 | 61 |
| 2017 | 108 | 54 |
| 2018 | 119 | 59 |
| 2019 | 106 | 52 |
| 2020 | 89 | 45 |
| 2021 | 86 | 47 |
| 2022 | 106 | 56 |
| 2023 | 105 | 52 |
| 2024 | 107 | 67 |
Data source: ARDD
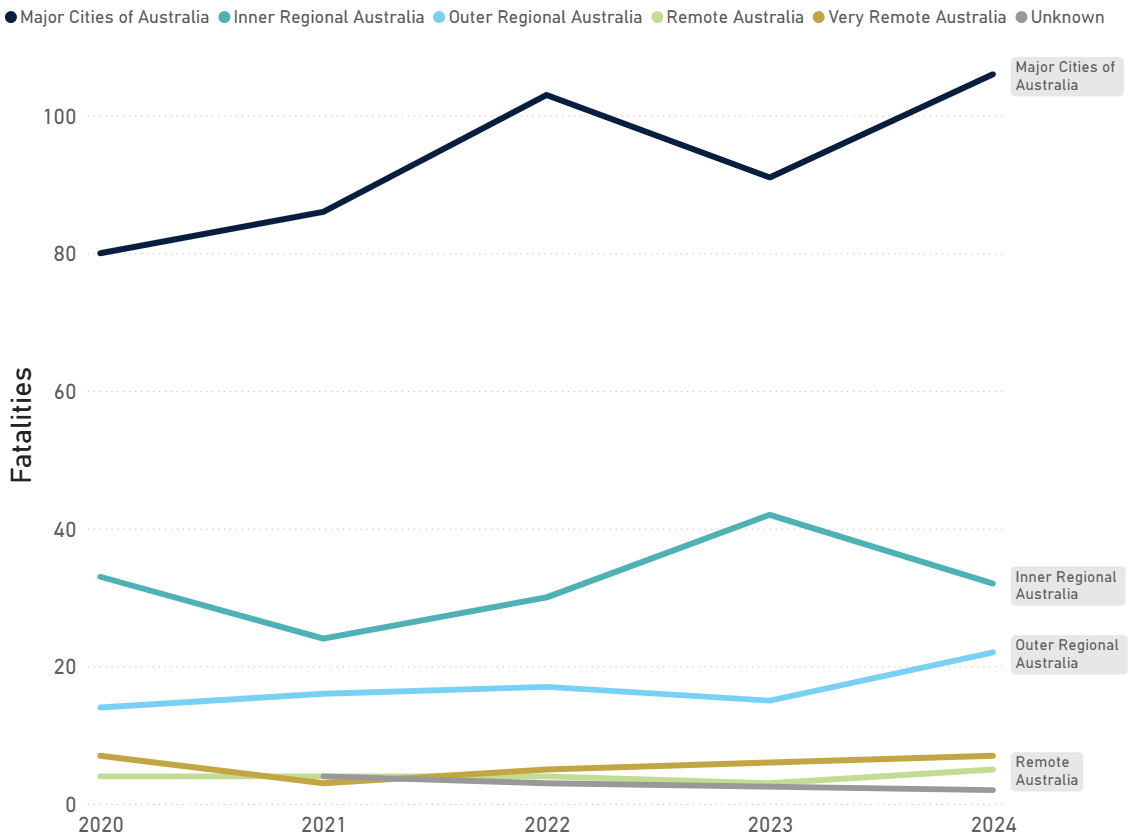
Location
Major cities have consistently reported the highest number of annual pedestrian fatalities between 2020-2024, and during this period reported an average of 93 pedestrian fatalities per year. These high fatality figures likely reflect increased pedestrian activity in urban areas.
The increase in ‘Unknown’ Remoteness Area in 2024 is mainly due to variations in reporting timeframes by jurisdiction. Updated location data is expected to be available by early 2026.
Annual pedestrian fatalities by ABS Remoteness Area, 2020-2024
Data source: ARDD
Annual pedestrian fatalities by ABS Remoteness Area, 2020-2024
| Year | Major Cities of Australia | Inner Regional Australia | Outer Regional Australia | Remote Australia | Very Remote Australia | Unknown |
|---|---|---|---|---|---|---|
| 2020 | 80 | 33 | 14 | 4 | 7 | - |
| 2021 | 86 | 24 | 16 | - | 3 | 4 |
| 2022 | 103 | 30 | 17 | 4 | 5 | 3 |
| 2023 | 91 | 42 | 15 | 3 | 5 | 1 |
| 2024 | 91 | 32 | 21 | 3 | 6 | 21 |
Data source: ARDD
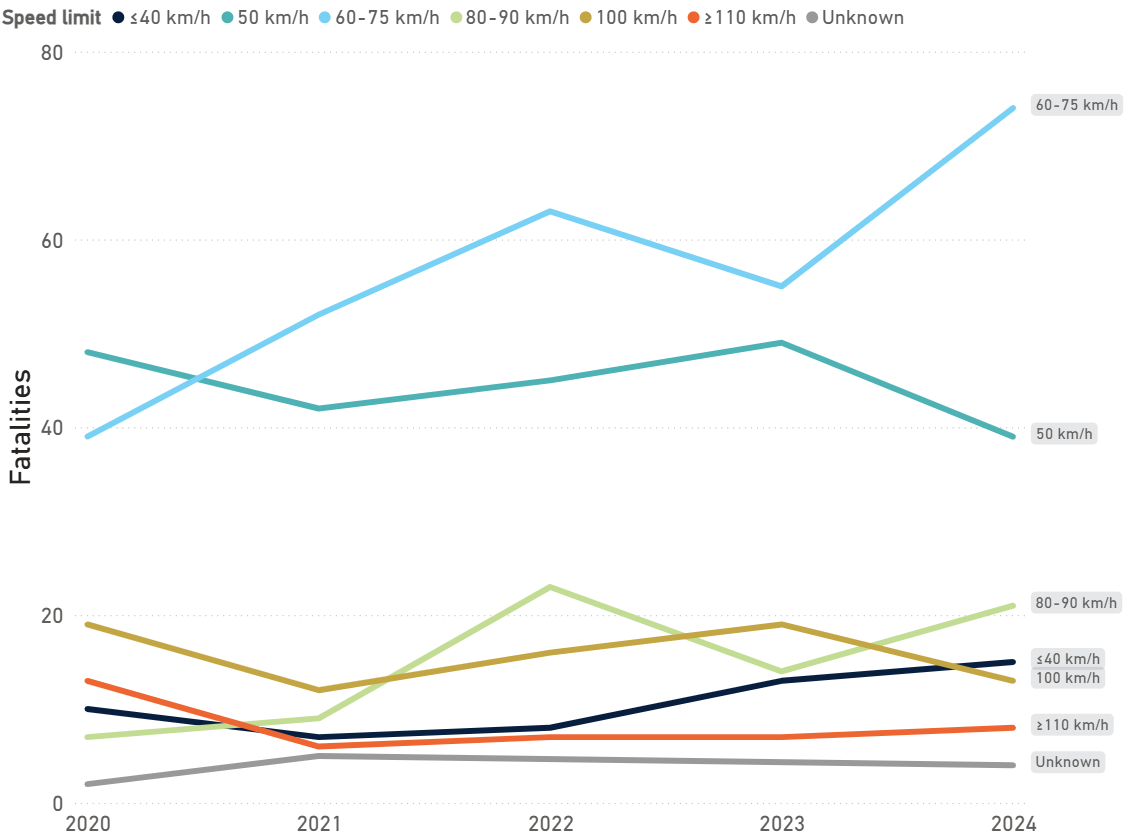
Speed limit
The majority (66.2%) of pedestrian deaths during the five years 2020-2024 were reported to occur in 50km/h or 60-75km/h speed zones. Low fatality figures in higher speed zones likely reflect that fewer pedestrians walk on high-speed roads.
Annual pedestrian fatalities by posted speed limit, 2020-2024
Data source: ARDD
Annual pedestrian fatalities by posted speed limit, 2020-2024
| Year | 0 to 40km/h | 50km/h | 60 to 75km/h | 80 to 90km/h | 100km/h | 110km/h or more | Unknown |
|---|---|---|---|---|---|---|---|
| 2020 | 10 | 48 | 39 | 7 | 19 | 13 | 2 |
| 2021 | 7 | 42 | 52 | 9 | 12 | 6 | 5 |
| 2022 | 8 | 45 | 63 | 23 | 16 | 7 | - |
| 2023 | 13 | 49 | 55 | 14 | 19 | 7 | - |
| 2024 | 15 | 39 | 74 | 21 | 13 | 8 | 4 |
Data source: ARDD
Definitions
Pedestrian
Person on foot, whether stationary or moving, lying, sitting or working, including:
- in a motorised wheelchair that cannot travel more than 10 kilometres per hour
- in or pushing a non-motorised wheelchair
- in or on a wheeled recreational device or wheeled toy
- riding a skateboard, in a pram, or a cart
- excluding a person riding a pedal cycle
In some jurisdictions this category includes e-scooters.
Pedestrian fatality
A pedestrian death that occurs as a result of a road crash and within 30 days of the crash.
Hospitalised injury
Injuries resulting in confirmed admission to hospital excluding in-hospital death from road traffic crashes. Traffic areas exclude off-road and unknown locations.
Road crash
A crash reported to police resulting from the movement of at least one road vehicle on a public road and involving death or injury to any person, or threshold property damage, that is not the result of a pre-meditated act.
About the data
Unless otherwise specified, all tables and figures use data for the whole of Australia.
Pedestrians and Road Safety(Opens in a new tab/window) published by the Bureau of Infrastructure and Transport Research Economics (BITRE) in May 2015 provided an overview of pedestrian safety in Australia and explored possible factors impacting the safety of pedestrians in a road crash. This webpage updates some of the content from this release and can be utilised alongside the original information sheet.
Australian road fatality data was obtained from the Australian Road Deaths Database(Opens in a new tab/window) (ARDD) as at December 2025 (with data current to November 2025). The ARDD provides basic details of road traffic crash fatalities in Australia as reported by the police each month to the State and Territory road safety authorities.
Hospitalised Injuries from Road Crashes(Opens in a new tab/window) data was sourced from the National Hospital Morbidity Database maintained by the Australian Institute of Health and Welfare (AIHW).
International fatality data was obtained from the IRTAD(Opens in a new tab/window) Road Safety Database which is maintained by the Joint Transport Research Centre of the OECD and the International Transport Forum.
Limitations
Road deaths from recent months are preliminary and are subject to revision.
References
- Cycling and Walking Australia and New Zealand, 2023, 'National Walking and Cycling Participation Survey'.
- Department of Infrastructure (Victoria), 2007, ‘Maintaining Mobility: The Transition from Driver to Non-Driver’.
- Oxley, J., Ihsen, E., Fildes, B., Charlton, J. and Day, R., 2005, ‘Crossing roads safely: An experimental study of age differences in gap selection by pedestrians’, Accident Analysis and Prevention, (37), 962-971pp.
Explore related data and insights


Have a question or feedback?
Contact the Road Safety Data Hub team