Key insights
- The social cost of road crashes was estimated to range between $22.2 and $30.3 billion per year, with a base case estimate of $27.0 billion annually between the years 2016-2020, derived using the Hybrid Human Capital approach.
- The $27.0 billion estimate was an increase of 12% in real terms compared to 2006, the year of the last Australian costing study (Bureau of Transport Economics 2009).
- The total social cost of road crashes increases by $600 million or 2% to $27.6 billion if the Willingness to Pay approach is used instead of the Hybrid Human Capital approach.
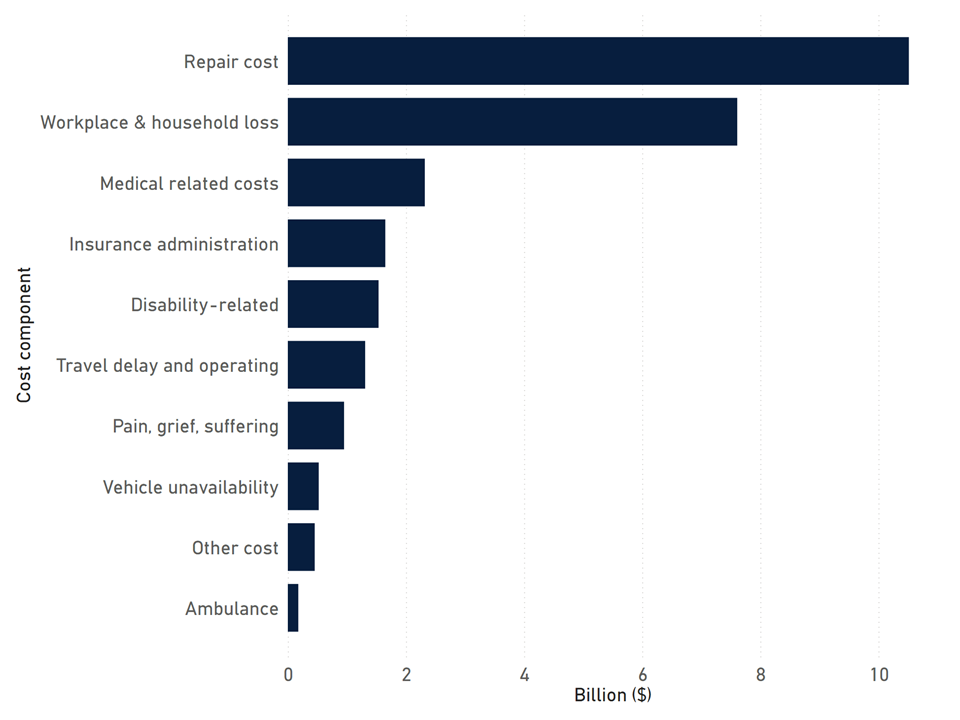
Social cost of road crashes by cost component (in billions, 2020 dollars)

Social cost of road crashes by cost component (in billions, 2020 dollars)
Cost component | Billion ($) |
|---|---|
Repair cost | $10.515 |
Workplace & household loss | $7.609 |
Medical related costs | $2.319 |
Insurance administration | $1.650 |
Disability-related | $1.536 |
Travel delay and operating | $1.309 |
Pain, grief, suffering | $0.952 |
Vehicle unavailability | $0.523 |
Other cost | $0.455 |
Ambulance | $0.177 |
Total | $27.045 |
Estimated social cost of road crashes by crash type group and remoteness (millions, 2020 dollars)
| Crash type groups | Major city | Outside major cities | Total | Per crash |
|---|---|---|---|---|
| Same direction | $7,097 | $1,598 | $8,695 | $25,361 |
| Run off road | $2,085 | $4,143 | $6,228 | $29,892 |
| Head on | $2,738 | $1,524 | $4,262 | $39,844 |
| Intersection adjacent | $2,499 | $1,308 | $3,807 | $26,637 |
| Pedestrian struck | $946 | $378 | $1,323 | $24,458 |
| All other crash types | $1,594 | $1,136 | $2,729 | $24,864 |
| Total | $16,958 | $10,087 | $27,043 | $28,003 |
About the data
We engaged the Australian National University to update the department’s estimate of the economic cost of road crashes, with the findings reported in Social Cost of Road Crashes(Opens in a new tab/window) (2022). This project went beyond the scope of the previous estimate in Cost of Road Crashes in Australia(Opens in a new tab/window) (2006) by including analysis to detail the financial burden of road crashes, and who bears that burden.
Best practice methods for estimating the economic cost of road crashes were adopted. The total cost of road crashes in Australia was derived in a bottom-up fashion by aggregating:
- Direct costs (the opportunity cost of health and non-health resources used by crash victims as a result of a road crash)
- Indirect costs (which account for potential productivity losses due to mortality, morbidity and informal care)
- Costs relating to pain, grief and suffering (which account for pain, grief, suffering and lost quality of life of those injured in a crash and of those near to those who have died in a crash).
Data were collected and averaged across 5 years (2016–2020) to account for variation in inputs. Two approaches to valuing indirect and human costs of road crashes (or non-direct costs) were used:
- (a) a Hybrid Human Capital approach, which centres on valuing loss of life, health and wellbeing on the basis of the cost of labour foregone in the economy and in the household.
- (b) the Willingness to Pay approach, which is the maximum amount of money a customer is willing to pay for a product or service.
Single and multivariate sensitivity analysis was used to gauge the range of uncertainty in the results and to test key parameters (including the discount rate), assumptions and data inputs.
Limitations
While the crash data used covers all fatal crashes, there is uncertainty around the incidence of hospitalised and non-hospitalised injuries and crashes where only property is damaged (‘property-damage-only’). Hence, there is a gap in current data on the number of road crash casualties who end up not being admitted to hospital or who do not go to an emergency room in the first place.
Similarly, we do not have a complete picture of the national number of on-road property-damage-only crashes, as reporting is not mandatory in most jurisdictions. Furthermore, the available industry data does not distinguish between on-road crashes and other types of claims.
We are currently missing data on the cost of street furniture damage and have relied on the numbers derived from Cost of Road Crashes in Australia(Opens in a new tab/window) (2006), potentially underestimating this category's actual costs. Therefore, it would be beneficial to gain access to jurisdictional data on the cost of repairing street furniture.
Explore related data and insights
Have a question or feedback?
Contact the Road Safety Data Hub team


