Key figures for May 2025
-
127Road deaths in May 202536.9% higher than the average for May over the previous 5 years
-
1,337Road deaths in past 12 months4.8% increase from the same time last year
-
501Vulnerable Road User deaths in the past 12 months5.9% increase from the same time last year
Latest 12 months
By road user
By age group
Change on previous 12 months
Monthly road deaths
last 5 years with trend
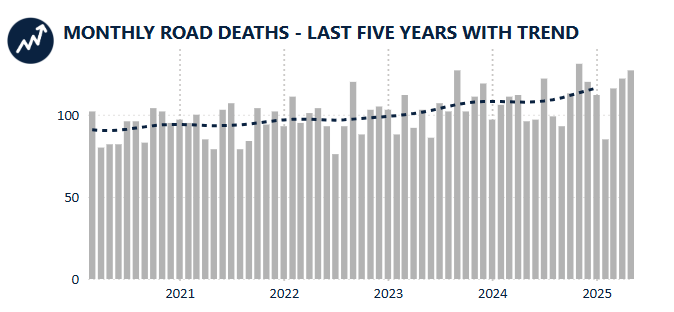
Monthly and annual deaths
Monthly fatalities over the last 5 years
| Year | Jan | Feb | Mar | Apr | May | Jun | Jul | Aug | Sep | Oct | Nov | Dec | Total |
|---|---|---|---|---|---|---|---|---|---|---|---|---|---|
| 2020 | 82 | 93 | 102 | 80 | 82 | 82 | 96 | 96 | 83 | 104 | 102 | 95 | 1,097 |
| 2021 | 97 | 95 | 100 | 85 | 79 | 103 | 107 | 79 | 84 | 104 | 94 | 102 | 1,129 |
| 2022 | 93 | 111 | 95 | 101 | 104 | 93 | 76 | 93 | 120 | 88 | 103 | 105 | 1,182 |
| 2023 | 103 | 88 | 112 | 92 | 103 | 86 | 107 | 102 | 127 | 102 | 111 | 119 | 1,252 |
| 2024 | 97 | 106 | 111 | 112 | 96 | 97 | 122 | 99 | 93 | 113 | 131 | 120 | 1,297 |
| 2025 | 112 | 85 | 116 | 122 | 127 | – | – | – | – | – | – | – | 562 |
Annual deaths - past 12 months
| 12 months end May | NSW | VIC | QLD | SA | WA | TAS | NT | ACT | Total |
|---|---|---|---|---|---|---|---|---|---|
| 2021 | 280 | 199 | 297 | 93 | 169 | 32 | 34 | 10 | 1,114 |
| 2022 | 289 | 241 | 297 | 88 | 152 | 49 | 46 | 15 | 1,177 |
| 2023 | 278 | 273 | 269 | 95 | 180 | 36 | 34 | 11 | 1,176 |
| 2024 | 349 | 283 | 286 | 96 | 173 | 30 | 52 | 7 | 1,276 |
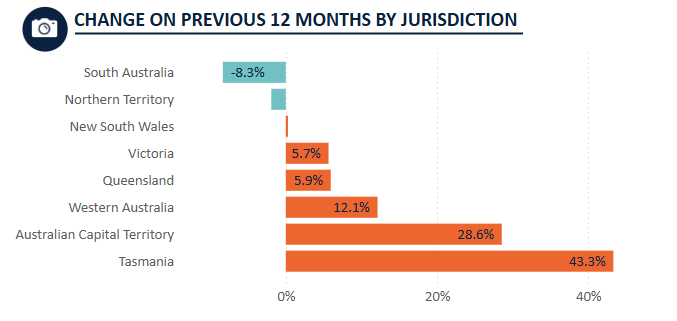
| 2025 | 350 | 299 | 303 | 88 | 194 | 43 | 51 | 9 | 1,337 |
| Latest per cent change | 0.3% | 5.7% | 5.9% | -8.3% | 12.1% | 43.3% | -1.9% | 28.6% | 4.8% |
Annual deaths - calendar year to date
| Year to date | NSW | VIC | QLD | SA | WA | TAS | NT | ACT | Total |
|---|---|---|---|---|---|---|---|---|---|
| Jan to May 2024 | 136 | 118 | 115 | 36 | 78 | 9 | 25 | 5 | 522 |
| Jan to May 2025 | 154 | 133 | 116 | 35 | 84 | 21 | 16 | 3 | 562 |
| Latest per cent change | 13.2% | 12.7% | 0.9% | -2.8% | 7.7% | 133.3% | -36.0% | -40.0% | 7.7% |
National fatality rate
For the 12 months ending May 2025, the national road fatality rate was 4.9 deaths per 100,000 people. This rate is 3.0% higher than the same time last year.
The fatality rate was 4.8 for the 12 months ending December 2024 and was 1.5% higher compared to the previous calendar year.
Fatality rate - past 12 months
| 12 months end May | NSW | VIC | QLD | SA | WA | TAS | NT | ACT | Total |
|---|---|---|---|---|---|---|---|---|---|
| 2021 | 3.5 | 3.0 | 5.7 | 5.2 | 6.2 | 5.7 | 13.7 | 2.2 | 4.3 |
| 2022 | 3.6 | 3.7 | 5.7 | 4.9 | 5.5 | 8.6 | 18.5 | 3.3 | 4.6 |
| 2023 | 3.4 | 4.1 | 5.0 | 5.2 | 6.4 | 6.3 | 13.5 | 2.4 | 4.5 |
| 2024 | 4.1 | 4.1 | 5.2 | 5.1 | 5.9 | 5.2 | 20.5 | 1.5 | 4.7 |
| 2025 | 4.1 | 4.2 | 5.4 | 4.7 | 6.5 | 7.5 | 19.9 | 1.9 | 4.9 |
| Latest per cent change | -1.1% | 3.5% | 3.9% | -9.4% | 9.5% | 42.9% | -2.7% | 26.6% | 3.0% |
Fatality rate - calendar year
| Calendar year | NSW | VIC | QLD | SA | WA | TAS | NT | ACT | Total |
|---|---|---|---|---|---|---|---|---|---|
| 2020 | 3.5 | 3.2 | 5.4 | 5.2 | 5.7 | 6.8 | 12.5 | 1.6 | 4.3 |
| 2021 | 3.4 | 3.5 | 5.3 | 5.5 | 6.0 | 6.2 | 14.1 | 2.4 | 4.4 |
| 2022 | 3.4 | 3.6 | 5.5 | 3.9 | 6.3 | 8.8 | 20.8 | 3.9 | 4.5 |
| 2023 | 4.1 | 4.3 | 5.0 | 6.3 | 5.5 | 5.8 | 12.2 | 0.9 | 4.7 |
| 2024 | 3.9 | 4.1 | 5.4 | 4.7 | 6.3 | 5.4 | 23.5 | 2.3 | 4.8 |
| Latest per cent change | -3.9% | -6.0% | 7.8% | -24.9% | 15.7% | -6.3% | 92.0% | 170.5% | 1.5% |
State comparison
Total deaths
For the 12 months ending May 2025, the states that experienced the most road deaths were New South Wales with 350 (0.3% increase on previous 12 months), followed by Queensland with 303 (5.9% increase). Australian Capital Territory had the lowest number of deaths in the past 12 months, with 9 (28.6% increase).
So far in 2025, the greatest number of deaths have occurred in New South Wales with 154 (13.2% increase), followed by Victoria with 133 deaths (12.7% increase).
Monthly deaths by state/territory
| Current month | NSW | VIC | QLD | SA | WA | TAS | NT | ACT | Total |
|---|---|---|---|---|---|---|---|---|---|
| May 2024 | 25 | 26 | 18 | 6 | 14 | 1 | 5 | 1 | 96 |
| May 2025 | 29 | 37 | 28 | 9 | 16 | 1 | 7 | 0 | 127 |
| Latest per cent change | 16.0% | 42.3% | 55.6% | 50.0% | 14.3% | 0.0% | 40.0% | -100.0% | 32.3% |
Annual deaths by state/territory - past 12 months
| 12 months end May | NSW | VIC | QLD | SA | WA | TAS | NT | ACT | Total |
|---|---|---|---|---|---|---|---|---|---|
| 2021 | 280 | 199 | 297 | 93 | 169 | 32 | 34 | 10 | 1,114 |
| 2022 | 289 | 241 | 297 | 88 | 152 | 49 | 46 | 15 | 1,177 |
| 2023 | 278 | 273 | 269 | 95 | 180 | 36 | 34 | 11 | 1,176 |
| 2024 | 349 | 283 | 286 | 96 | 173 | 30 | 52 | 7 | 1,276 |
| 2025 | 350 | 299 | 303 | 88 | 194 | 43 | 51 | 9 | 1,337 |
| Latest per cent change | 0.3% | 5.7% | 5.9% | -8.3% | 12.1% | 43.3% | -1.9% | 28.6% | 4.8% |
Annual deaths by state/territory - calendar year to date
| Year to date | NSW | VIC | QLD | SA | WA | TAS | NT | ACT | Total |
|---|---|---|---|---|---|---|---|---|---|
| Jan to May 2024 | 136 | 118 | 115 | 36 | 78 | 9 | 25 | 5 | 522 |
| Jan to May 2025 | 154 | 133 | 116 | 35 | 84 | 21 | 16 | 3 | 562 |
| Latest per cent change | 13.2% | 12.7% | 0.9% | -2.8% | 7.7% | 133.3% | -36.0% | -40.0% | 7.7% |
Fatality rate
Fatality rates more accurately describe the risk of death within jurisdictions by adjusting for population. The fatality rate for Northern Territory reached 19.9 per 100,000 people for the 12 months ending May 2025 (2.7% decrease from the previous year). Tasmania had the second highest rate at 7.5 per 100,000 people (42.9% increase from the previous year), 2.67 times lower than that of Northern Territory. Australian Capital Territory reported the lowest fatality rate, at 1.9 deaths per 100,000 people (26.6% increase from the previous year).
Fatality rate by state/territory - past 12 months
| 12 months end May | NSW | VIC | QLD | SA | WA | TAS | NT | ACT | Total |
|---|---|---|---|---|---|---|---|---|---|
| 2021 | 3.5 | 3.0 | 5.7 | 5.2 | 6.2 | 5.7 | 13.7 | 2.2 | 4.3 |
| 2022 | 3.6 | 3.7 | 5.7 | 4.9 | 5.5 | 8.6 | 18.5 | 3.3 | 4.6 |
| 2023 | 3.4 | 4.1 | 5.0 | 5.2 | 6.4 | 6.3 | 13.5 | 2.4 | 4.5 |
| 2024 | 4.1 | 4.1 | 5.2 | 5.1 | 5.9 | 5.2 | 20.5 | 1.5 | 4.7 |
| 2025 | 4.1 | 4.2 | 5.4 | 4.7 | 6.5 | 7.5 | 19.9 | 1.9 | 4.9 |
| Latest per cent change | -1.1% | 3.5% | 3.9% | -9.4% | 9.5% | 42.9% | -2.7% | 26.6% | 3.0% |
Fatality rate by state/territory - calendar year
| Calendar year | NSW | VIC | QLD | SA | WA | TAS | NT | ACT | Total |
|---|---|---|---|---|---|---|---|---|---|
| 2020 | 3.5 | 3.2 | 5.4 | 5.2 | 5.7 | 6.8 | 12.5 | 1.6 | 4.3 |
| 2021 | 3.4 | 3.5 | 5.3 | 5.5 | 6.0 | 6.2 | 14.1 | 2.4 | 4.4 |
| 2022 | 3.4 | 3.6 | 5.5 | 3.9 | 6.3 | 8.8 | 20.8 | 3.9 | 4.5 |
| 2023 | 4.1 | 4.3 | 5.0 | 6.3 | 5.5 | 5.8 | 12.2 | 0.9 | 4.7 |
| 2024 | 3.9 | 4.1 | 5.4 | 4.7 | 6.3 | 5.4 | 23.5 | 2.3 | 4.8 |
| Latest per cent change | -3.9% | -6.0% | 7.8% | -24.9% | 15.7% | -6.3% | 92.0% | 170.5% | 1.5% |
Deaths by demographics and circumstances
Road users
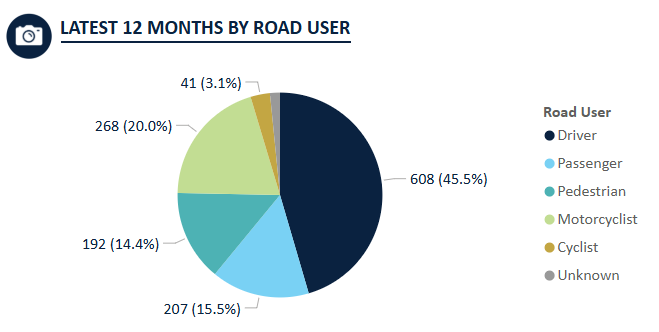
Road deaths are grouped by vehicle type and position to describe deaths by road user type. By this measure, deaths were most frequently drivers, with 608 in the 12-month period ending May 2025 (a 5.2% increase compared to the previous 12 months). Motorcyclists were the next most highly represented, with 268 deaths in the period (3.2% decrease).
Road user
| 12 months end May | Driver | Passenger | Pedestrian | Motorcyclist | Pedal cyclist | Total |
|---|---|---|---|---|---|---|
| 2021 | 552 | 177 | 121 | 225 | 35 | 1,114 |
| 2022 | 562 | 189 | 147 | 229 | 39 | 1,177 |
| 2023 | 540 | 199 | 158 | 236 | 39 | 1,176 |
| 2024 | 578 | 207 | 166 | 277 | 30 | 1,276 |
| 2025 | 608 | 207 | 192 | 268 | 41 | 1,337 |
| Latest per cent change | 5.2% | 0.0% | 15.7% | -3.2% | 36.7% | 4.8% |
Motorcyclist and Pedal cyclist categories include pillion passengers
Totals may include unknown values
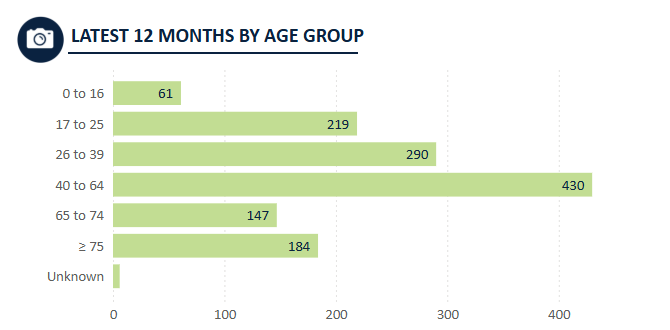
Age group
In the 12-month period ending May 2025, 32.2% of road deaths were aged 40 to 64 years (430 deaths). This was followed by 21.7% of deaths for those aged 26 to 39 years (290 deaths).
Comparing the change in deaths by age group for the most recent 12 months compared to previous:
- The cohort with the greatest decrease in deaths was people aged 17 to 25 years, with 18 fewer deaths (7.6% decrease from 237 to 219 deaths).
- The cohort with the greatest increase in deaths was people aged 40 to 64 years, with 45 more deaths (11.7% increase from 385 to 430 deaths).
Age group (years)
| 12 months end May | 0 to 7 | 8 to 16 | 17 to 25 | 26 to 39 | 40 to 64 | 65 to 74 | ≥ 75 | Total |
|---|---|---|---|---|---|---|---|---|
| 2021 | 22 | 45 | 218 | 279 | 335 | 93 | 121 | 1,114 |
| 2022 | 18 | 45 | 226 | 248 | 362 | 122 | 152 | 1,177 |
| 2023 | 15 | 49 | 227 | 258 | 365 | 114 | 147 | 1,176 |
| 2024 | 17 | 47 | 237 | 284 | 385 | 143 | 161 | 1,276 |
| 2025 | 23 | 38 | 219 | 290 | 430 | 147 | 184 | 1,337 |
| Latest per cent change | 35.3% | -19.1% | -7.6% | 2.1% | 11.7% | 2.8% | 14.3% | 4.8% |
Totals may include unknown values
Gender
In the past year, around 3.1 times more males than females were involved in fatal crashes. In the 12 months to May 2025, 1,004 males died in crashes, compared to 329 females. This imbalance has increased recently, as the road death count for males increased from 979 to 1,004 in the past 12 months (2.6% increase) compared to female road deaths, which increased from 296 to 329 deaths (11.1% increase).
Remoteness area
The majority of road deaths in the last 12 months (369 deaths, 27.6%) occurred in inner regional areas. Very remote regions made up the smallest proportion of road deaths at 1.9%, reporting 26 deaths.
In recent years, remoteness area has not been routinely provided, resulting in a significant increase in Unknown remoteness area. We suggest caution interpreting findings from this chart, as total deaths in all other regions may be underreported.
Remoteness area
| 12 months end May | Major cities | Inner regional | Outer regional | Remote | Very remote | Unknown | Total |
|---|---|---|---|---|---|---|---|
| 2021 | 362 | 367 | 248 | 57 | 65 | 15 | 1,114 |
| 2022 | 398 | 382 | 264 | 68 | 54 | 11 | 1,177 |
| 2023 | 444 | 379 | 247 | 42 | 54 | 10 | 1,176 |
| 2024 | 402 | 419 | 262 | 63 | 47 | 83 | 1,276 |
| 2025 | 362 | 369 | 257 | 39 | 26 | 284 | 1,337 |
| Latest per cent change | -10.0% | -11.9% | -1.9% | -38.1% | -44.7% | 242.2% | 4.8% |
Totals may include unknown values
Fatal crashes
Road crashes are a leading cause of death and hospitalised injuries in Australia. It’s important to understand their underlying factors, especially crashes that result in at least one fatality.
Single and multiple vehicle crashes
Most fatal crashes involve a single vehicle, totalling 676 crashes in the past 12 months ending May 2025 (54.7% of all fatal crashes). There were 553 fatal crashes involving multiple vehicles (6.3% increase from previous year).
There has been a 4.8% increase for single-vehicle crashes, from 645 to 676 fatal crashes in the 12 months ending May 2025.
Speed limit
Of all fatal road crashes in the past 12 months, 27.5% (340) happened in 100 km/h zones (2.0% decrease from previous year). This was followed by 305 fatal crashes in 60 to 75 km/h zones (5.2% increase from previous year). Fatal crashes in 60 to 75 km/h zones had the greatest increase, with 15 more deaths (5.2% increase from 290 to 305 deaths).
Speed limit (km/h)
| 12 months end May | ≤ 40 | 50 | 60 to 75 | 80 to 90 | 100 | ≥ 110 | Total |
|---|---|---|---|---|---|---|---|
| 2021 | 14 | 113 | 237 | 182 | 345 | 132 | 1,034 |
| 2022 | 21 | 130 | 271 | 169 | 354 | 136 | 1,091 |
| 2023 | 30 | 117 | 295 | 178 | 317 | 144 | 1,086 |
| 2024 | 32 | 149 | 290 | 201 | 347 | 140 | 1,169 |
| 2025 | 28 | 128 | 305 | 208 | 340 | 132 | 1,235 |
| Latest per cent change | -12.5% | -14.1% | 5.2% | 3.5% | -2.0% | -5.7% | 5.6% |
Totals may include unknown values
Explore the data
Explore the monthly deaths data in dashboard format. The dashboard allows further drilling down by categories such as age group, jurisdiction and road user.
Definitions
Road death
A person who dies within 30 days as a result of injuries received in an unintended crash on a public road.
Fatal injuries are coded using the World Health Organisation (WHO) International Statistical Classification of Diseases and Related Health Problems (ICD-10) system. For more details, see ICD-10 Version 2010(Opens in a new tab/window)
Fatality rate
The fatality rate allows for easier like-for-like comparison between states and territories and other sub-groups as it is not affected by differences in the sizes of the populations. In particular, it refers to the count of road deaths in the last 12 months divided by the resident population at the midpoint of that period, multiplied by 100,000. Population estimates are sourced from ABS' national, state and territory population statistics. The midpoint population may be interpolated if necessary.
Fatal crash
A crash reported to police resulting from the movement of at least one road vehicle on a public road and involving at least one death that is not the result of a pre-meditated act.
Vulnerable Road User
Road users not in a car, bus or truck, generally including pedestrians, motorcyclists and pedal cyclists. Can also include children 7 years and under, the elderly and users of mobility devices.
About the data
We collect the data from each state and territory and collate them in the Australian Road Deaths Database.
The raw data are obtained from:
- Transport for NSW(Opens in a new tab/window)
- Department of Transport and Planning, Victoria(Opens in a new tab/window)
- Department of Transport and Main Roads, Queensland(Opens in a new tab/window)
- Department for Infrastructure and Transport, SA(Opens in a new tab/window)
- Western Australia Police Force(Opens in a new tab/window)
- Department of State Growth, Tasmania(Opens in a new tab/window)
- Department of Infrastructure, Planning and Logistics, NT(Opens in a new tab/window)
- Transport Canberra and City Services, ACT(Opens in a new tab/window)
- Australian Bureau of Statistics(Opens in a new tab/window)
Download data
CKAN Data Catalogue:
- Road deaths Australia bulletin(Opens in a new tab/window)
- Australian Road Deaths Database(Opens in a new tab/window)
Note: If CKAN is offline, refer to file downloads above.
Limitations
Road deaths from recent months are preliminary and are subject to revision.
Explore related data and insights


Have a question or feedback?
Contact the Road Safety Data Hub team